


The goal is simple: I want quality stocks with a large competitive advantage and a solid financial balance sheet at a decent price. I built a digital analyst that does just that for me. So instead of screening raw metrics without context
It pulls financial and news data from 900+ stocks
It analyses financials over time and benchmarks them against peers
It weighs the metrics according to a defined scheme

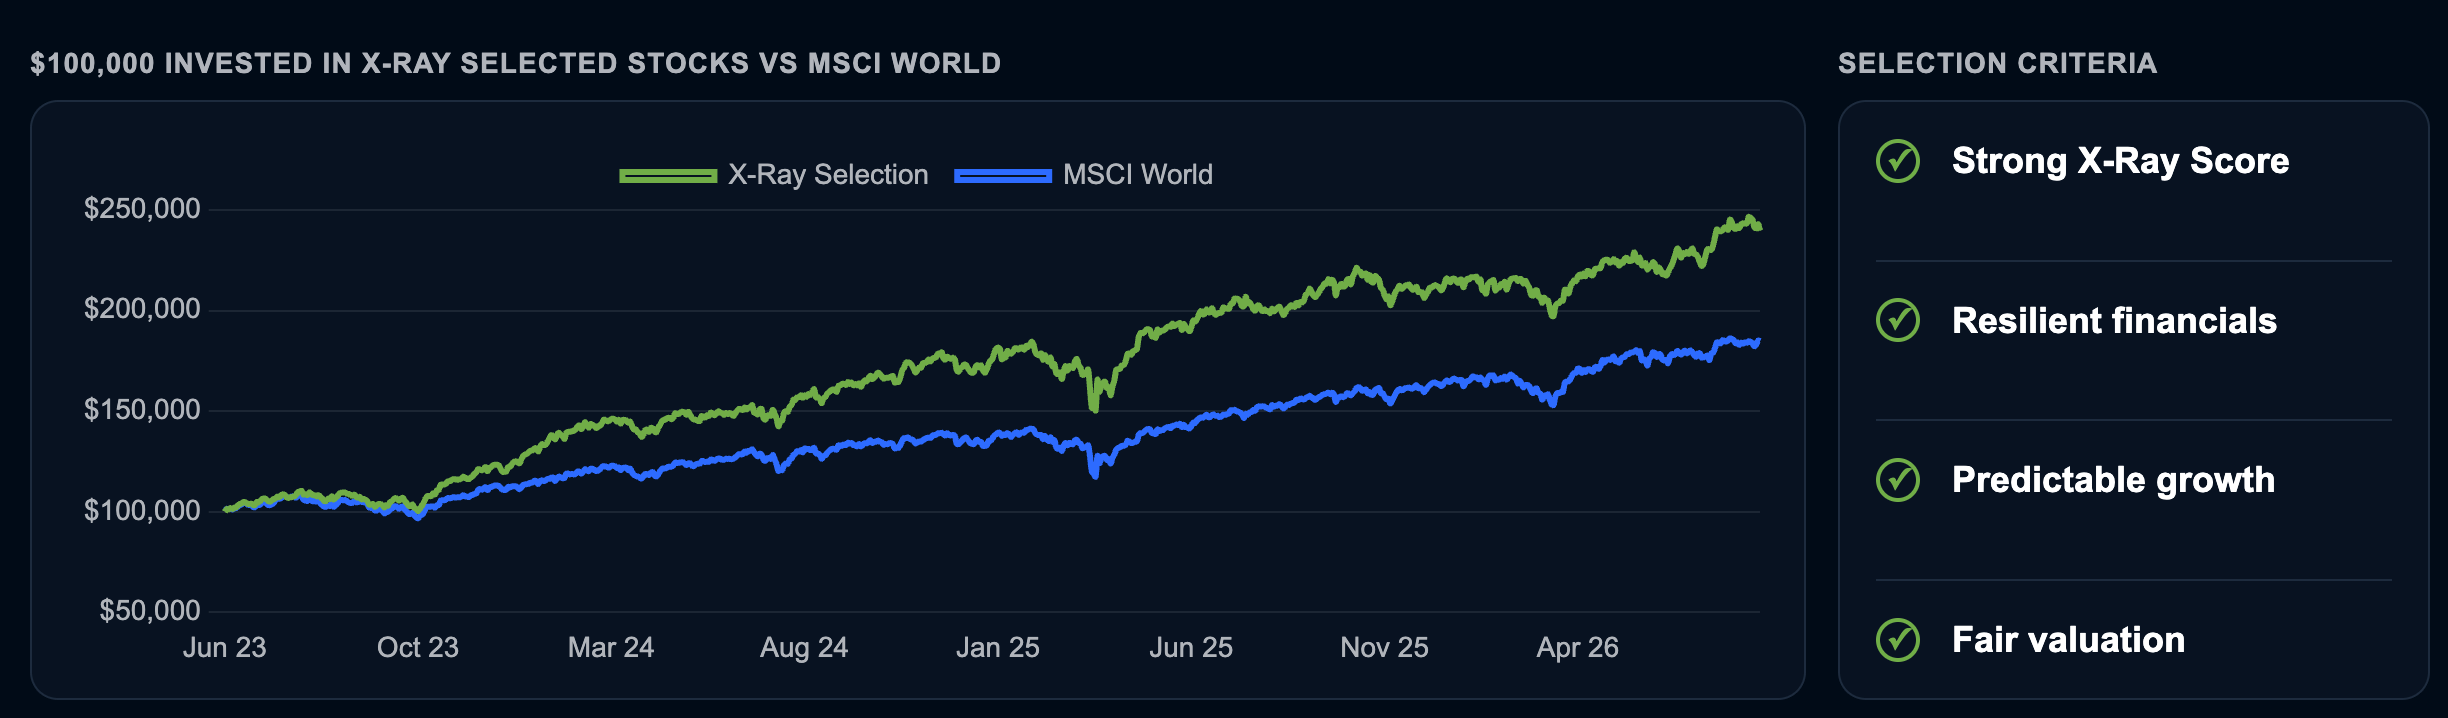
The result is the Financial X-Ray portfolio that consists of 40 stocks and has performed well over the last 3 years. To track the performance I invested 100k to equal parts 3 years ago. If a new position is added or sold the portfolio is rebalanced proportionally.
3 years is not 20 years but it’s proof that the framework deserves attention.
Not many trades have been made. last month nothing was added or sold - it is a buy and hold portfolio aiming to avoid hype.
As a free subscriber you can use the tool freely on my website (S&P 100 coverage) https://www.theinsideanalyst.com/financial-x-ray
As a paid subscriber, you have access to over 900 stocks, the full X-Ray portfolio and the ability to build and roast your own portfolio by the X-Ray algorithm.
What’s inside the portfolio?
From the free S&P 100 universe the X-Ray portfolio holds and classifies these stocks as clean strong buys.
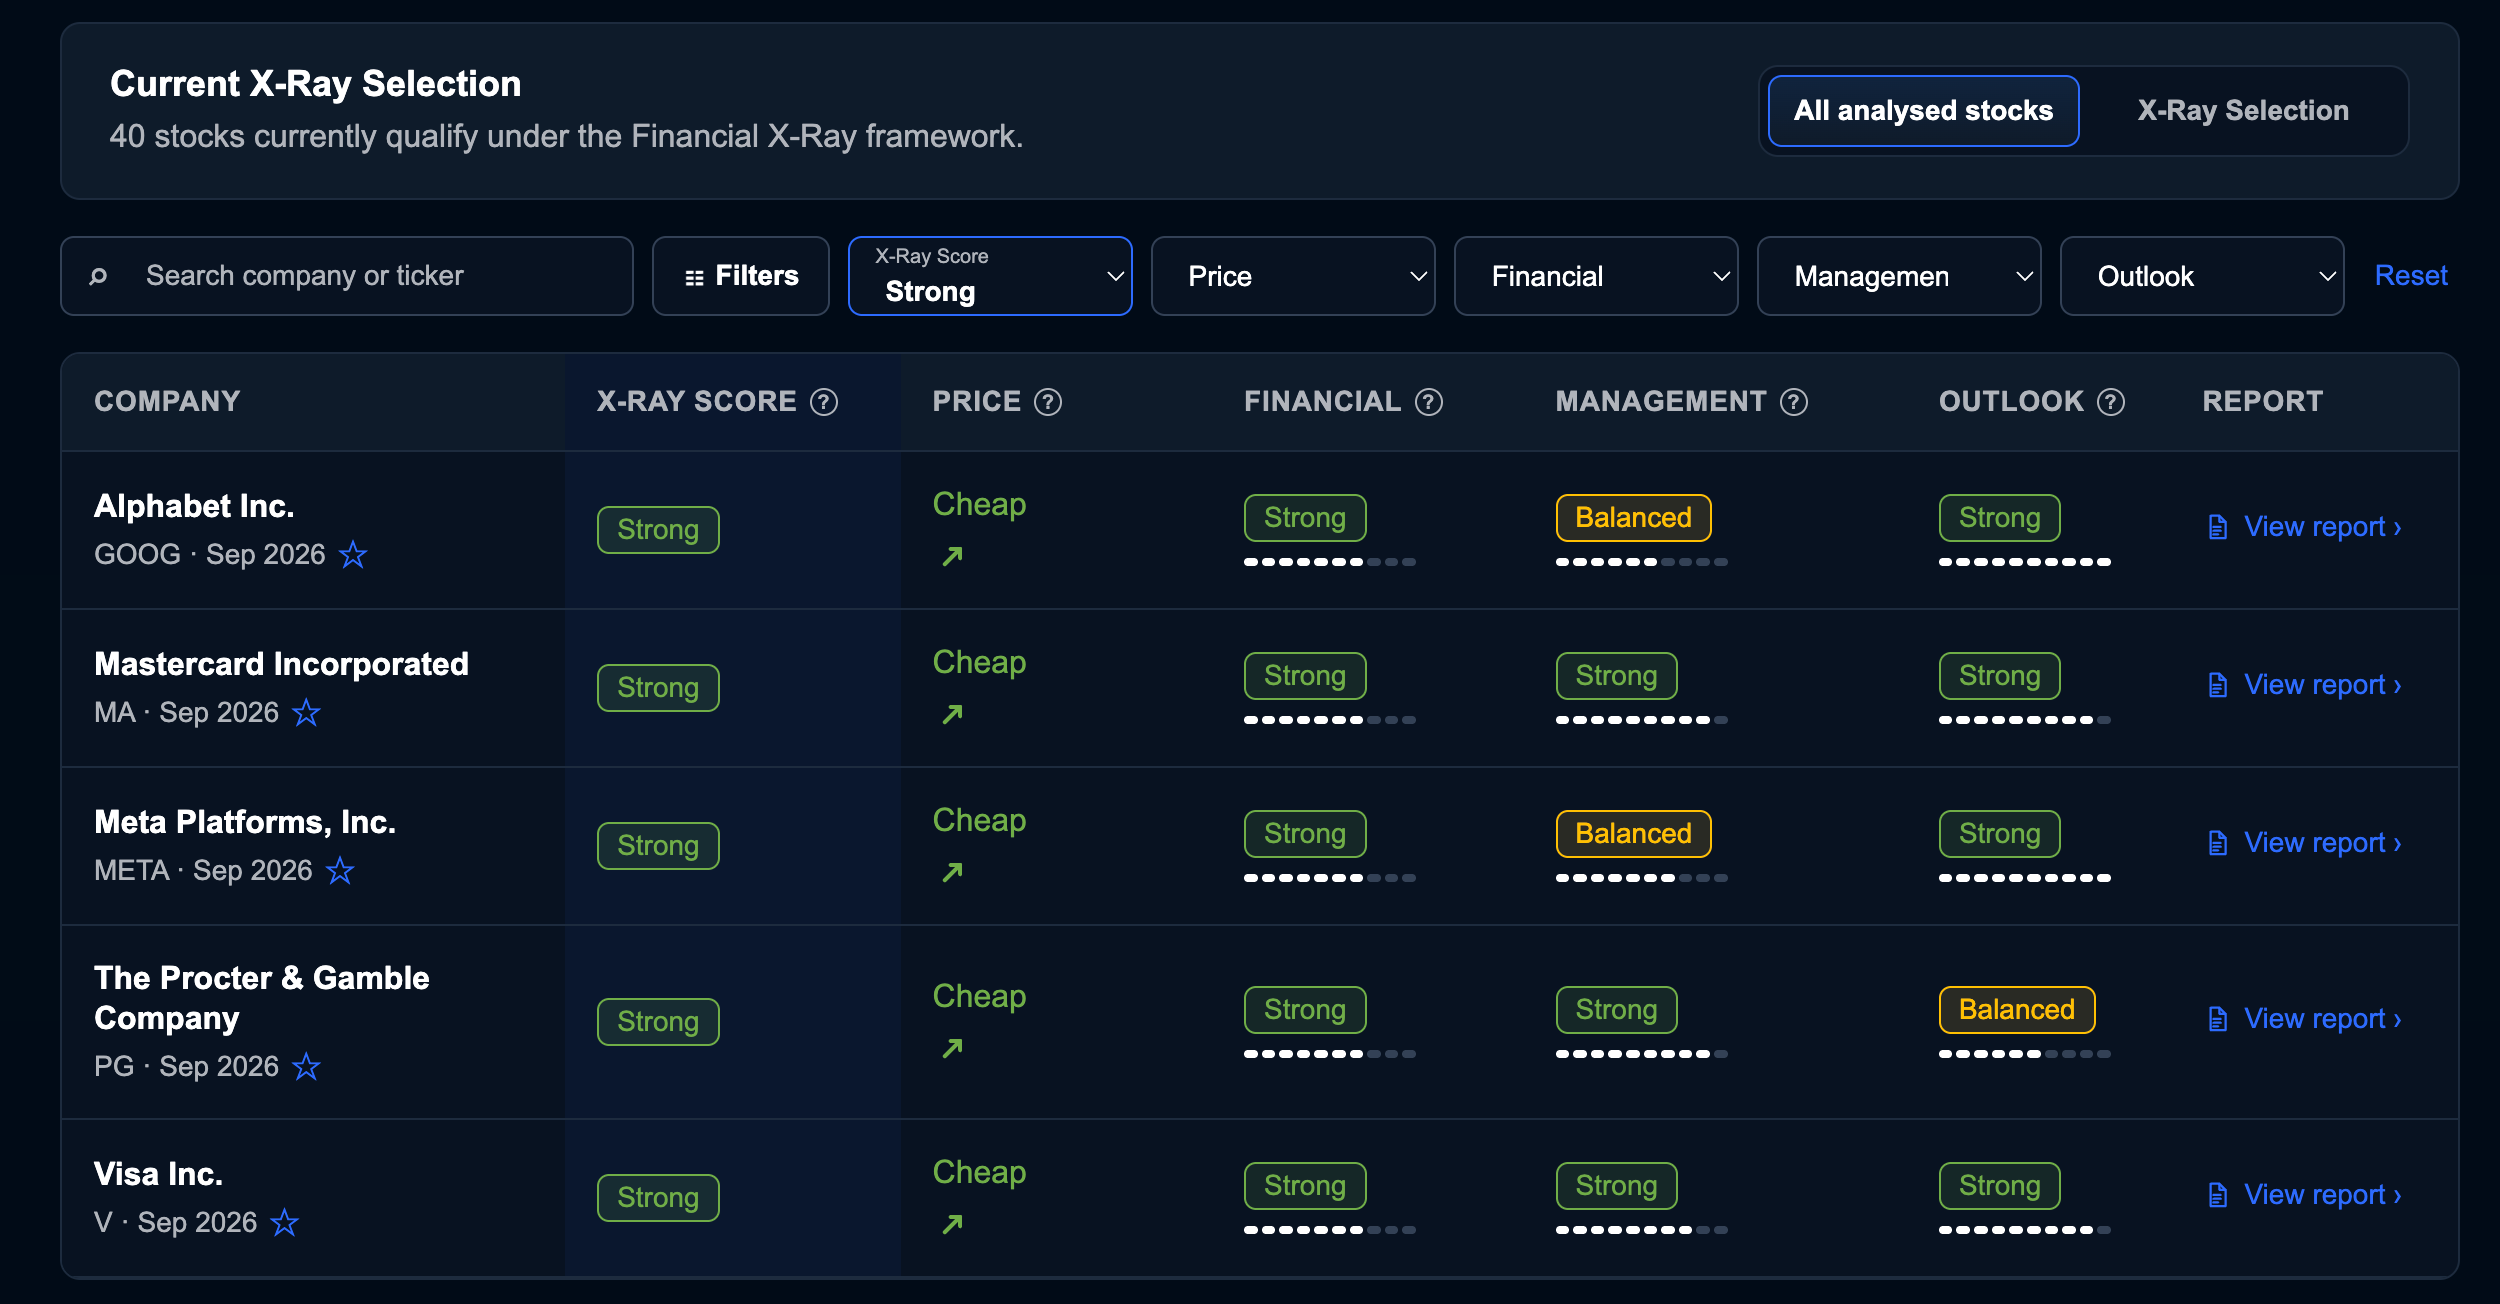
The common thread across these five companies is the ability to turn revenue into durable profits and cash, while maintaining financial flexibility. That is something equity analysts call resilience even in economic downturns. I focus on strong fundamentals over time, so one-off effects get eliminated. However, the most recent quarters support the historical trends in these cases.
1. Alphabet
Growth and profitability: Revenue increased from $162bn in 2019 to $403bn in 2025, while EBITDA margin expanded from 31.8% to 44.9%. That combination points to substantial operating leverage and a business that has become more profitable as it scales.
Financial resilience: Free cash flow reached $71.7bn, with net debt of just 0.2x EBITDA. The balance sheet provides flexibility to fund AI and Cloud investment without relying heavily on external financing.
Quality of growth: Revenue quality is rated Strong, supported by stable growth across advertising and cloud. The main concern is capital intensity, with capex rising to 23.1% of revenue in 2025.
Valuation: At 30.8x TTM earnings and a 1.8% FCF yield, Alphabet is not cheap on absolute multiples. The X-Ray nevertheless rates valuation Strong, reflecting its growth and financial quality. Future returns on elevated AI investment will be important to justify the premium.
2. Meta
Growth and profitability: Revenue rose from $70.7bn in 2019 to $201bn in 2025, while EBITDA margin increased from 49.1% to 52.0%. The advertising platform continues to generate exceptional profitability at scale.
Cash and balance sheet: Free cash flow reached $41.9bn and leverage remains low at 0.5× EBITDA. This gives Meta the capacity to fund large investments, although net debt has increased.
The key trade-off: Capex rose to 36.8% of revenue and ROIC fell to 5.1% in 2025. The business remains strong, but the economics of the AI investment cycle are now central to the thesis.
Valuation: At 26x TTM earnings and a 2.7% FCF yield, Meta trades at a lower earnings multiple than Alphabet despite similarly strong profitability. The X-Ray rates valuation Strong, but the discount must be weighed against heavier capital spending and execution risk.
3. Visa
Durable profitability: Revenue grew from $23.0bn in 2019 to $40.0bn in 2025, while EBITDA margins remained between 65% and 72%. Even during 2020, revenue declined only 4.9%, demonstrating the resilience of the payment network.
Exceptional capital efficiency: ROIC improved from 18.7% to 24.3%, and free cash flow reached $20.7bn. These figures support the X-Ray’s assessment of sector-leading margins and returns.
Financial strength: Net debt is only 0.2x EBITDA, leaving substantial flexibility for buybacks, dividends and investment without stretching the balance sheet.
Valuation: Visa trades at 34.9x TTM earnings and a 3.0% FCF yield. The premium is supported by unusually stable margins, strong returns and low leverage. The X-Ray rates valuation Strong, although the multiple leaves less room for disappointment.
4. Mastercard
Consistent growth: Revenue nearly doubled from $16.9bn in 2019 to $32.8bn in 2025, with growth of 16.4% in the latest year. EBITDA margins remained around 60–62%, showing that expansion has not come at the expense of profitability.
Outstanding returns: ROIC increased from 34.4% to 36.5%, while free cash flow reached $16.9bn. The X-Ray rates revenue and EBITDA quality Strong, reflecting growth and execution that compare favourably with sector norms.
Balance sheet: Net debt stands at only 0.4x EBITDA, supporting continued investment and shareholder returns.
Valuation: At 33.9x TTM earnings and a 3.3% FCF yield, Mastercard is priced for quality. The X-Ray rates valuation Strong, supported by its combination of double-digit growth and exceptional capital efficiency. The key question is whether those returns can remain durable as the business scales.
5. Procter & Gamble
Defensive revenue: Sales increased from $71.0bn in 2020 to $87.0bn in 2026, without an annual decline. Growth is modest, but the consistency reflects recurring demand across essential consumer categories.
Stable profitability and cash: Net margins stayed between 17.7% and 19.0%, while annual free cash flow remained above $12bn. This supports the X-Ray’s assessment of strong cash generation and resilience through changing economic conditions.
Conservative leverage: Net debt is 1.2× EBITDA, while the dividend yield is 2.9%. For a business in the defensive sector these are very good levels.
Valuation: At 21.7x TTM earnings and a 4.5% FCF yield, P&G offers a higher cash-flow yield than the other four companies. The X-Ray rates valuation Strong, but with revenue growth of only 3.3% and EBITDA margin falling to 24.4% in 2026, the investment case depends on stability and cash returns rather than accelerating growth.
These businesses can hardly be called speculative. They form part of the portfolio and remain attractively valued even today.
Behind the paywall I’ll reveal 5 more companies that are part of the X-Ray selection, still at attractive levels and with decent upside potential and I also reveal the entire 40 stock portfolio.
2 Companies in the financial sector, 1 Real estate player, 1 BioTech comp and 1 Software business (4 of which are US companies and 1 European stock).