


Caterpillar is a global manufacturer selling construction, mining equipment, engines, turbines, and financial products across various industries. In short, an industrial conglomerate.

The company operates in cyclical end markets and faces demand fluctuations based on construction, mining, and energy trends in multiple regions. Its largest segments demonstrate significant exposure to North America and split as follows:
Construction Industries: ~39%
Power & Energy: ~39%
Resource Industries: ~22%
In order to understand if we should commit capital, we must look at the financials.
What changed beneath the surface
These signals rarely move in isolation. When read together, they often reveal structural dynamics beneath the surface of a business. (Full framework)
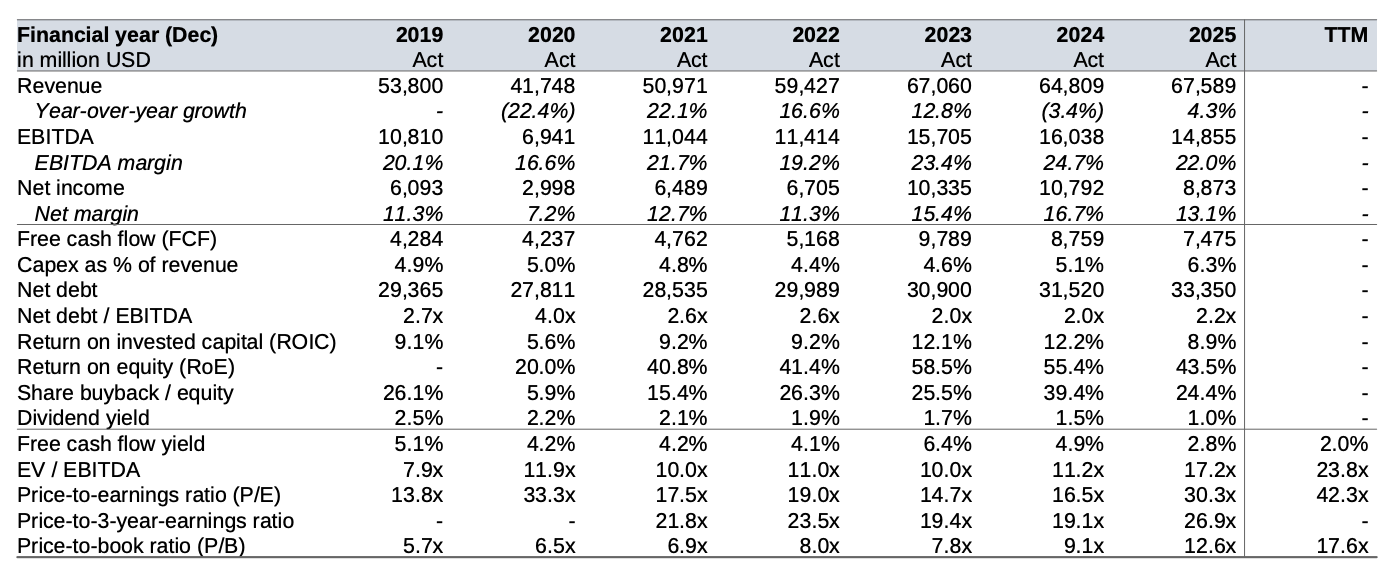
Caterpillar’s historical numbers hardly resemble a growth company.
Revenue is cyclical. It rose sharply after the pandemic (22%) and the years after but has turned negative in 2024 ( -3.4%) before recovering slightly to 4.3% in 2025.
Margins fluctuated with the cycle, are in line with the sector and have followed a stable sideways trend.
ROIC declined from 12.2% to 8.9% indicating a severe decline in capital efficiency. Recall that ROIC must exceed the company’s cost of capital (8-10%) in order to create value for shareholders.
FCF fell from $9.8bn in 2023 to $7.5bn in 2025 partly driven by capital spending and by demand shifts.
Debt has remained stable at an elevated but acceptable level for the sector.
Then 2026 changed the trajectory.
Q2 sales increased 24% to $20.5bn. AI infrastructure adds a new dimension: Q2 Power Generation sales increased 29%, driven partly by large engines and turbines for data centers.
net profit rose 60% to $3.6bn, and net margin expanded from 13.3% to 17.6% . Importantly, $3.1bn of the $4.0bn sales increase of Q2 came from higher volume rather than price.
The order backlog (secured contracts likely to translate into revenue) more than doubled in the first half of 2026 and stands at $72bn. That is more than the entire 2025 revenue.
In short: we see an improvement across the entire income statement and and increase in valuation multiples.
The pattern at work
Everything points to another form of durability overpricing here. Recall that this recurring pattern is characterized as follows.
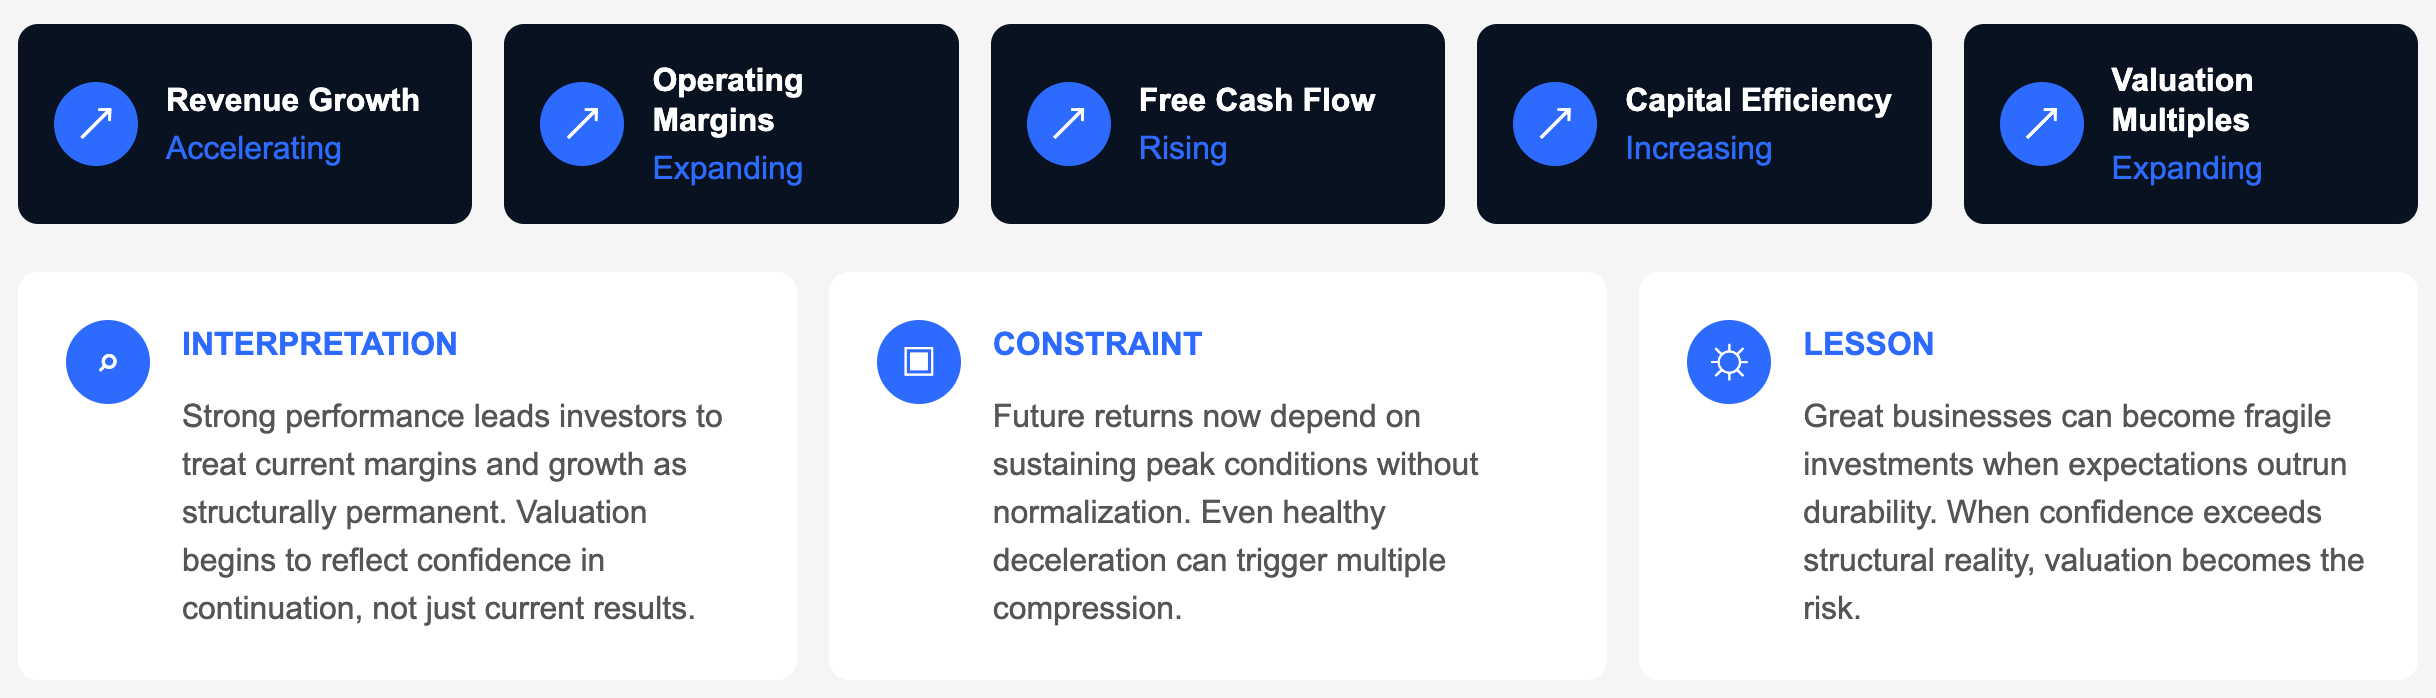
And that’s exactly what we observe when we look at Caterpillar. But we must clarify what that means for valuation and for the durability of earnings first before concluding our thoughts. (See details on the pattern here).
Why investors may misread this phase and what return we can expect.
The acceleration has substance. Managements states that 59% of the magnificent order backlog is expected to convert within 12 months. That alone provides unusually strong visibility for a cyclical industrial company. In addition, growth has reaccelerated, margins are expanding and capital spending remains disciplined.
So, Caterpillar deserves a higher valuation than its 2024–25 numbers alone suggest. But investors have already repriced that improvement.
Caterpillar trades at 42x PE and 2% FCF yield - levels associated with tech and growth companies. So let’s look at 3 Scenarios as reliable estimates for the following five years:
Scenario 1 - conservative
Normalized valuation of 30x earnings, 3.5% FCF yield
Growth of 10% and reliable cash conversion in line with Management target (historical growth 0-10%)
Expected annual return = 7-9%.
Scenario 2 - optimistic
Valuation stays elevated as growth turns out to be resilient. 40x earnings, 2.5% FCF yield
Growth of 15% and reliable cash conversion
Expected annual return = 14-16%.
Scenario 3 - Financial X-Ray
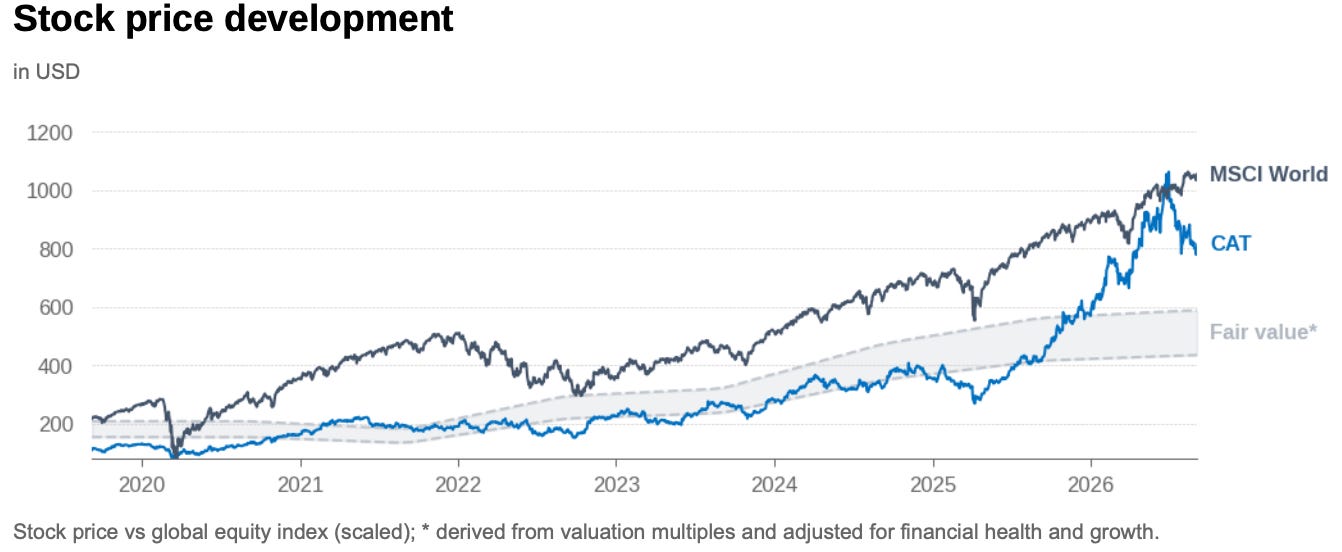
The X-Ray adjusts the current valuation multiples determined by the market for growth and financial resilience to derive a fair value band.
The fair-value band is therefore placed below the stocks current price and suggests further downside.
The risk is not that growth disappears. It is that growth normalizes while the valuation multiple does the same.
Caterpillar still depends heavily on construction, mining and energy cycles. A larger backlog improves visibility, it does not eliminate cyclicality.
The insight
Caterpillar is becoming a better business.
The $72bn backlog, accelerating volumes and growing exposure to data-center power generation provide more visibility than Caterpillar historically enjoyed. Management also appears to be investing into demonstrated demand rather than stretching the balance sheet to manufacture growth.
But the stock has changed even faster than the business.
Investors are no longer paying a cyclical-company valuation for Caterpillar. They are increasingly paying for structural growth.
That can work if today’s growth proves durable. But at the current valuation, simply remaining an excellent cyclical industrial company may no longer be enough.
If you’ve made it this far take a closer look at the Financial X-Ray
The tool helps you “X-Ray” more than 800 stocks in seconds so you know where strengths and weaknesses sit across financials, management, growth and valuation.
It’s a screener for analysed conclusions, not raw metrics.
Stocks that perform well on all categories have outperformed the S&P 500 by more than 50% over the past 3 years.
Leave me a comment or send a DM, I’m always here for questions and discussions. Here’s the way to the X-Ray: Thanks for reading.
Quick check on Scenario 1. If the multiple goes from 42x to 30x over five years, that's roughly a 6.5% annual headwind, which eats most of the 10% earnings growth. Even adding back a 2 to 3% cash yield, I land closer to 5 or 6% a year than 7 to 9%. Am I missing a piece, like buybacks shrinking the share count, or is the 30x applied to a higher earnings base than today's?
The detail that worries me most is one you present as reassuring: $3.1bn of the $4.0bn Q2 increase came from volume. Volume gains on a fixed cost base are operating leverage, which is how net margin jumped from 13.3% to 17.6%, and operating leverage works in reverse too. So the 42x multiple sits on margins that are themselves inflated by the cycle. Scenario 1 normalizes the multiple but not the margin, so it only covers half of that exposure. Power Generation also has a borrowed-durability problem: data-center builders' capex pays for that surge, so Caterpillar's visibility is really its customers' conviction, one step removed. The old cyclical rule says buy at a high P/E and sell at a low one. Nobody wrote a rule for paying a high P/E on peak earnings.