


ETF’s are a great way to buy several equities at once. Transaction costs are limited, management fees are low and diversification is often guaranteed. For many private investors, these instruments are seen as the best way to invest if your time is limited.
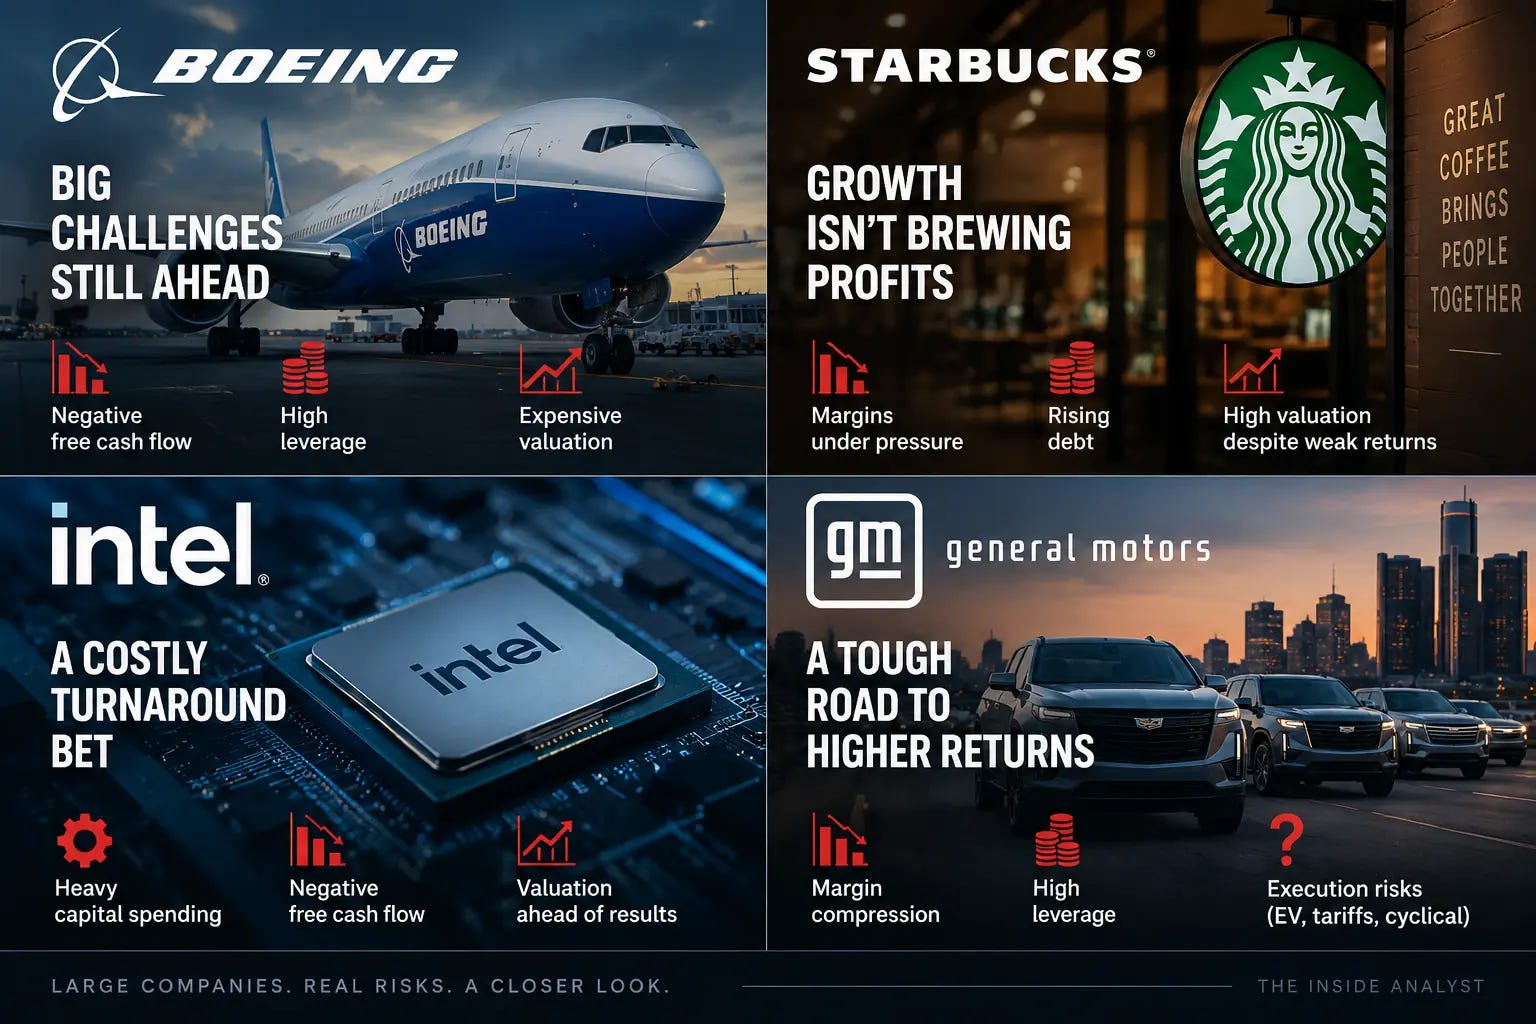
But what if I told you that anyone can actually do better than than. How? Simply by dropping the losers, the companies that trade at expensive multiples while displaying deteriorating financials and a weak outlook.
Let’s take a look at Americas largest companies in the S&P 100 and 7 stocks that are not worth owning at the moment and how to detect them in seconds.
What about the No-No-List?
Well, here we go.
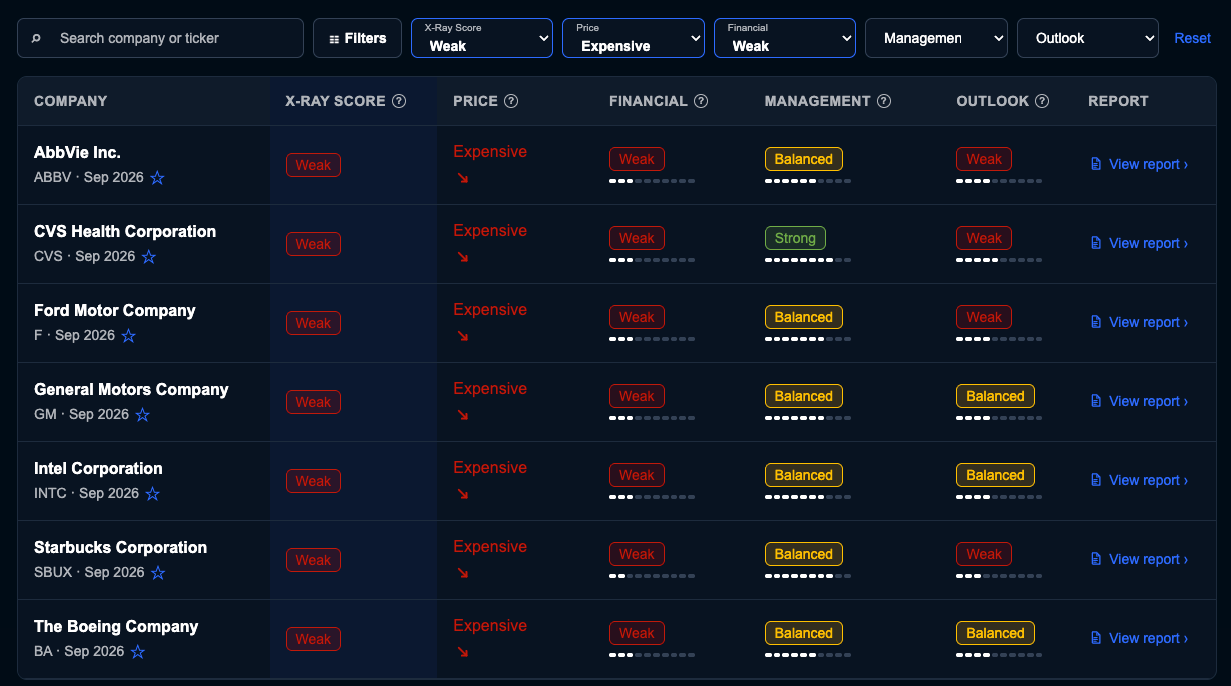
But the more interesting question is: What do these companies have in common and why should we avoid them?
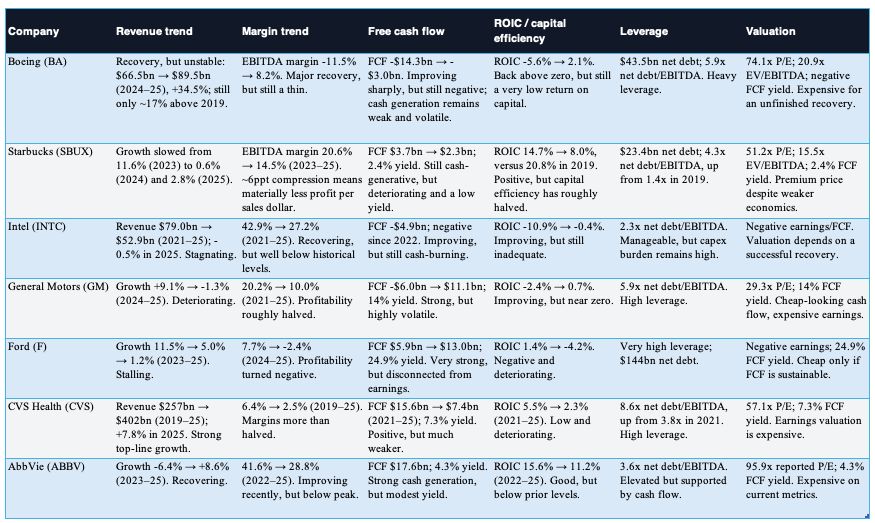
The problem is that today's valuation offers insufficient compensation for weak visibility into normalized margins, cash flow and returns on capital. Let’s examine these companies in detail over the past 5-7 years.
Boeing
Financials: The recovery is visible, but not durable yet: FCF was still -$3.0bn in 2025, ROIC only 2.1%, and leverage remains heavy at 5.9x net debt/EBITDA.
Valuation: Around 74x 2025 earnings and 21x EV/EBITDA is a demanding price for a company still rebuilding profitability and cash generation.
Watch: Everything depends on execution, especially 737 MAX production rates, 737-7/10 certification and deliveries. Boeing recently acknowledged that 737 production has not stabilized at its targeted rate, which hit the stock. A better bet here is on Airbus.
Starbucks
Financials: Growth stalled while EBITDA margin fell from 20.6% to 14.5% and ROIC from 14.7% to 8.0%. Debt rose while the economics weakened.
Valuation: Roughly 51x 2025 earnings, 15.5x EV/EBITDA and just a 2.4% FCF yield leave little room for a disappointing turnaround.
Watch: The Back to Starbucks turnaround is bringing customers back, but at considerable labor/reinvestment cost. The next question is whether traffic recovery actually converts into durable margin recovery, I don’t see it.
Intel
Financials: Revenue fell from $79bn to $53bn, FCF remains negative and ROIC is around zero. Enormous capex has yet to produce attractive returns.
Valuation: With negative earnings and FCF, investors are effectively paying today for future turnaround economics that haven’t arrived yet.
Watch: Intel Foundry is the swing factor. It still lost $4.5bn in H1 2026, while Intel itself acknowledges the enormous investment and competitive challenge of taking on TSMC and other foundries. Technology is evolving quickly, trying to catch TSMC is huge hurdle.
General Motors
Financials: EBITDA margin fell from 20.2% to 10.0%, ROIC is around 0.7%, and leverage remains high. Strong headline FCF hasn’t translated into consistently strong capital returns.
Valuation: A 14% historical FCF yield looks cheap, but ~29x reported 2025 earnings tells a very different story. The problem is knowing what normalized earnings and FCF actually are.
Watch: Tariffs and the EV reset. GM estimates 2026 tariff effects of $2.5–3.5bn (current EBITDA ~$20bn) and has already taken billions in EV-strategy charges. Q2 operations improved, but the range of outcomes remains unusually wide. GM must invest heavily while facing cost pressure everywhere, the result: unpredictable and negative free cash flows.
Ford
Financials: Revenue barely moved while 2025 EBITDA and ROIC turned negative. FCF looks excellent, but the enormous swings between earnings, cash flow and returns make normalized profitability difficult to establish.
Valuation: A 24.9% historical FCF yield screams cheap but only if that cash flow is repeatable. Negative earnings make conventional P/E essentially useless. BTW this is another example that shows why screening raw metrics is little helpful.
Watch: Ford remains exposed to EV restructuring, tariffs, product mix and manufacturing execution. Q2 2026 improved materially, but it also contained $4.2bn of special charges (to compare: EBITDA = $10-15bn), largely related to BlueOval SK and EV cancellations. That’s exactly the visibility problem.
CVS Health
Financials: Revenue climbed from $257bn to $402bn, yet EBITDA margin collapsed from 6.4% to 2.5%, ROIC fell to 2.3%, and leverage reached 8.6x net debt/EBITDA, that is an extreme value (> 3.0x times deserves attention).
Valuation: The 7.3% FCF yield looks reasonable, but reported earnings imply a much richer valuation. Cheap cash flow alone doesn’t compensate for deteriorating returns and leverage.
Watch: The big variable is Aetna’s medical-cost economics. Encouragingly, its medical benefit ratio improved to 87.4% from 89.9% in Q2 2026, but membership, Medicare Advantage economics and reimbursement remain crucial to whether that improvement proves durable.
AbbVie
Financials: AbbVie generates substantial cash, but FCF, capex, margins and debt have been unusually lumpy. ROIC has fallen from 15.6% to 11.2%, while acquisitions make the underlying capital requirements harder to normalize.
Valuation: A roughly 4.3% FCF yield offers limited compensation for that uncertainty. Reported P/E is distorted, so I would emphasize FCF yield and EV/EBITDA rather than the 96x headline P/E.
Watch: The investment case increasingly rests on Skyrizi and Rinvoq replacing Humira and the pipeline / acquisition machine continuing to work. Those two drugs already represented about 42% of 2025 revenue, while AbbVie continues to use M&A including its proposed Apogee acquisition to replenish future growth.
And how do we detect these companies in seconds?
Before investing you should sanity check your stock pick for the exact same metrics discussed herein. Growth, margins, cash flow, capital spending, capital efficiency and debt often reveal a lot about the direction of the stock. If it company scores well on all of them it is not a guaranteed winner but the probability of a costly mistake is highly reduced.
The Financial X-Ray does the job for you in seconds, it tells you exactly what companies break and at what metric. It weighs the numbers for you.
A strong business follows a simple formula:
Quality = Strong financials + Strong Management + Decent outlook + reasonable price
Together that’s what gives a stock an X-Ray score of STRONG.
As a free subscriber you have access to all S&P 100 companies and their assessment including deep dive reports.
Paid subscribers have access to over 800 evaluated stocks and the X-Ray portfolio that invests in the best of them and has outpaced the S&P 500 significantly on a risk-adjusted basis and in absolute terms.
Very useful work. Thanks!!