

Uber Finally Became a Cash Machine That Looks Deceptively Cheap – Opportunity or Trap?
A Financial X-Ray on Uber reveals a business that has fundamentally improved, but one where valuation metrics paint a more nuanced picture.

For years, Uber was the poster child for growth at all costs.
Revenue expanded rapidly, but profits remained elusive. The company burned billions of dollars in cash, relied heavily on external funding and faced constant questions about whether its business model could ever generate sustainable returns.

That story has changed.
Today, Uber is consistently profitable, generates billions in free cash flow and has strengthened its balance sheet. Yet despite this remarkable transformation, the stock continues to trade below its estimated fair value.
At first glance, the conclusion seems obvious.
Uber looks cheap.
Let’s focus on what the Financial X-Ray – a platform that covers 800+ stocks and helps you see strengths and painpoints in seconds –reveals.
What changed beneath the surface
The financial transformation over the past few years has been remarkable.
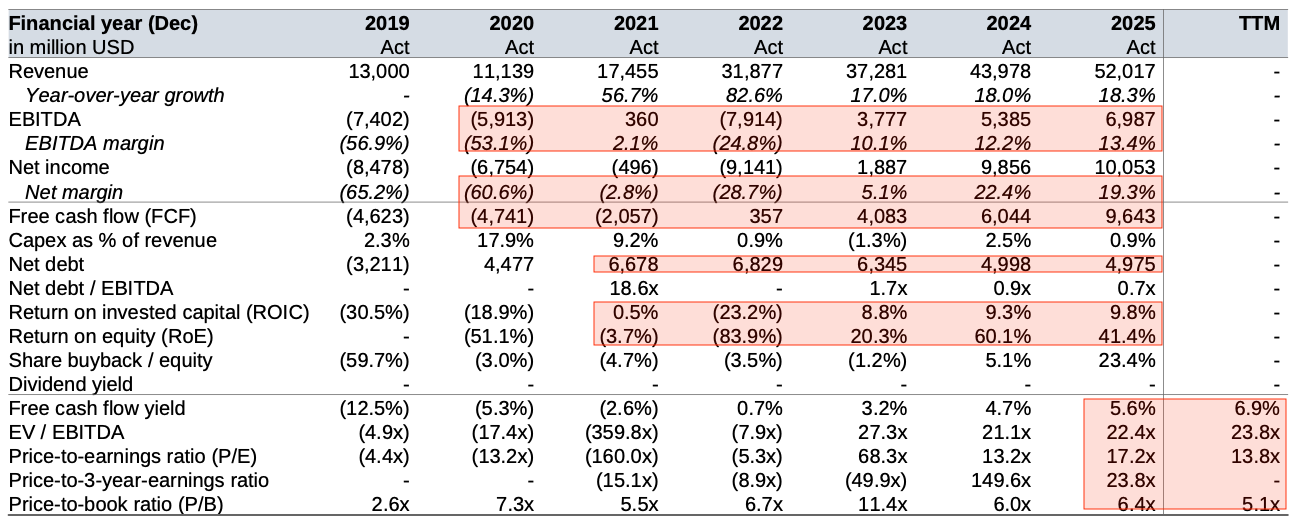
The biggest change isn’t that the company generates more revenue – it’s that the business has fundamentally changed how it earns money.
Revenue has grown from $13 billion in 2019 to more than $52 billion in 2025, but revenue growth alone doesn’t create shareholder value. Many technology companies can grow quickly by spending aggressively. The important question is whether that growth eventually translates into profits and cash generation.
This is where Uber’s transformation becomes evident.
EBITDA has improved from a $7.4 billion operating loss to almost $7 billion of positive operating earnings. This tells us the business is no longer relying on scale alone. As Uber has expanded, each additional ride and delivery has become increasingly profitable, demonstrating meaningful operating leverage (increased unit profitability).
The strongest signal, however, comes from cash generation.
Free cash flow has increased from negative $4.6 billion to almost $9.6 billion. Cash flow is ultimately what allows a company to repay debt, invest in future growth, acquire competitors or return capital to shareholders. A business that consistently generates cash has far more strategic flexibility than one that depends on external financing.
The balance sheet tells a similar story.
Net debt (total debt minus cash) has fallen steadily while return on invested capital (ROIC - that measure the profit per dollar invested) has turned positive after years of negative returns.
Together, these metrics suggest that Uber is not only becoming financially stronger, but is also generating better returns from the capital already invested in the business.
That is an important sign that growth is becoming more efficient rather than simply larger.
Taken together, the financials show a company entering a new phase.
For years, Uber’s investment case depended on whether its business model would ever produce sustainable profits. Today, that question has largely been answered. The discussion has shifted from whether Uber can generate cash to how durable that cash generation will prove to be and if today’s price reflects that accordingly.
The pattern at work
Unlike many previous Financial X-Ray case studies, Uber does not fit neatly into one recurring financial pattern.
Instead, the financials highlight a different analytical lesson.
Revenue: Strong growth
EBITDA: Strong improvement
Free cash flow: Strong and improving
Net debt: Declining
Return on invested capital: Improving
Valuation: More attractive than it appears
The operating business has clearly become stronger.
However, analysts should also examine how today’s valuation metrics are produced.
Headline valuation ratios can sometimes paint a more attractive picture than the underlying operating performance alone.
Why investors often misread this phase and what it implies for valuation
Uber currently appears inexpensive on several commonly used valuation measures.
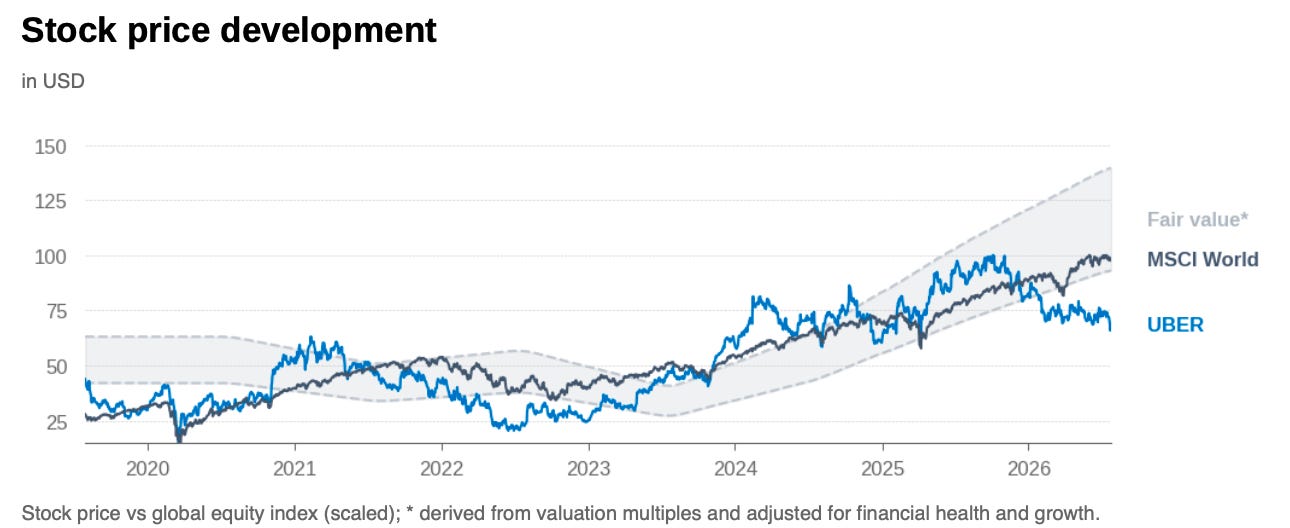
Its P/E ratio has fallen sharply to just 13.8x, while its free cash flow yield has improved to 6.9% as profitability has increased.
At the same time, the business itself has genuinely improved. Cash generation is strong. Leverage has fallen. Returns on capital continue to improve.
On the surface, those metrics suggest a meaningful margin of safety.
The fair value band captures this balance well.
But wait, why is a company trading at these multiples and growing at 18% per year backed by strong fundamentals only slightly undervalued?
The Financial X-Ray encourages investors to look one step deeper.
A significant portion of Uber’s reported net income in recent years was supported by the release of deferred tax valuation allowances. These accounting benefits increased reported earnings and free cash flow by 5.7bn and 4.3bn in 2024-25 accounting for 40-50% of net income but did not reflect additional operating profitability. (You can easily spot these abnormalities if net income > free cash flow > EBITDA. That order should mostly be reversed).
As a result, the headline P/E ratio makes the business appear somewhat cheaper than its underlying operating earnings would suggest.
The adjusted and sustainable P/E ratio would rather sit at 25x instead of 13.8x. That is nearly twice as high and a normal level for a technology business.
If investors target a 10% annual stock price increase, what growth rate do they need to expect over the next decade?
In 10 years I’d expect Uber to be a mature and well established technology platform that is a leading player in the transportation segment and as such it could trade at 20x earnings. To achieve that and accounting for the tax valuation allowances that are going to fade away, Uber must grow at 12% annually – a realistic but not a certain assumption, given its current growth rate of 18%.
Uber is not a value trap.
Nor is it the deep bargain that headline valuation metrics might imply.
Although the shares trade below estimated intrinsic value, the discount is moderated by adjusted financial, limited earnings visibility, regulatory uncertainty, execution risk and the long-term impact autonomous vehicles could have on Uber’s business model.
In other words, the market is recognising both sides of the story.
A much stronger business.
But one whose future remains more difficult to forecast than today’s valuation ratios alone suggest.
The insight
Uber has undergone one of the most impressive financial transformations in large-cap technology.
The company has evolved from a cash-burning growth story into a highly cash-generative platform with improving profitability, stronger returns on capital and a healthier balance sheet.
That deserves recognition.
At the same time, disciplined investors should avoid relying on headline valuation metrics in isolation.
Reported earnings can be influenced by accounting items that do not reflect the economics of the operating business, making simple valuation multiples appear more attractive than they really are.
The Financial X-Ray therefore reaches a balanced conclusion.
Uber appears modestly undervalued, but not by the margin that headline P/E and free cash flow metrics might initially suggest.
Looking beyond a single ratio and understanding how those numbers are generated is often the difference between finding genuine value and simply finding an attractive-looking multiple.
The Financial X-Ray helps you arrive at these conclusion in seconds. Stocks that are flagged healthy across financial health, management quality, growth and valuation have outperformed the S&P 500 by 55% over the past 3 years. Explore the platform behind it.